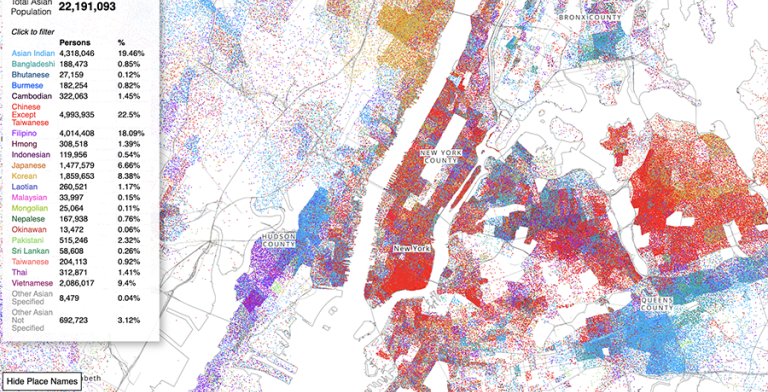
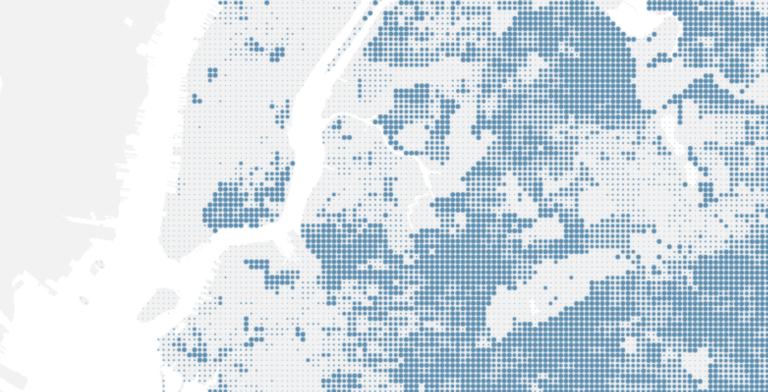
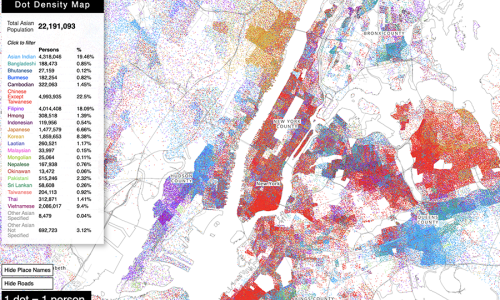
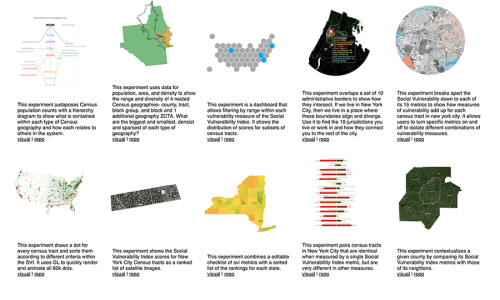
The Asian American Dot Density map represents each Asian American as 1 dot color coded by 21 different racial groups found in Census data. The map reveals the complex spatial dynamics of specific asian racial groups in places across the country.
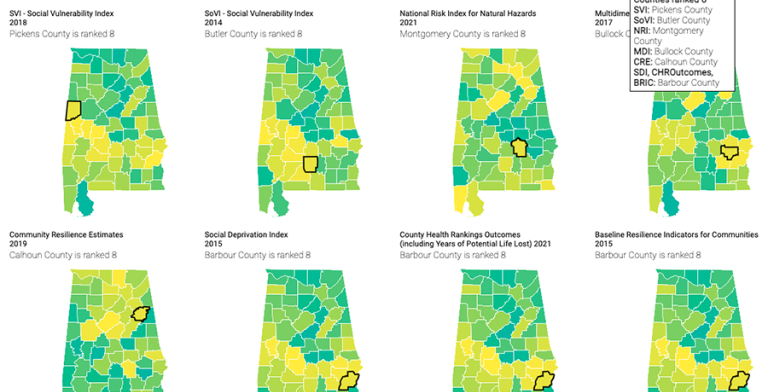
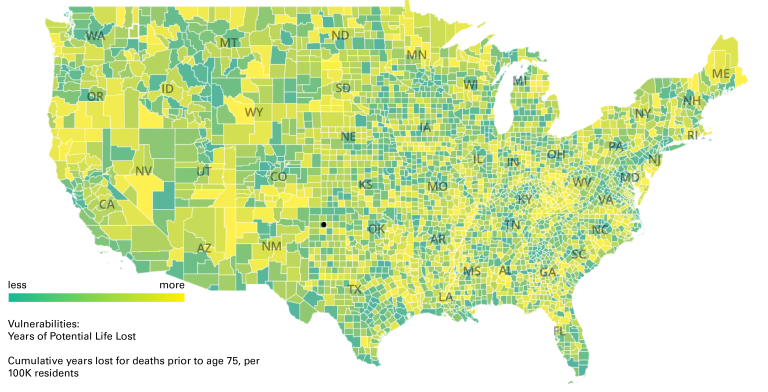
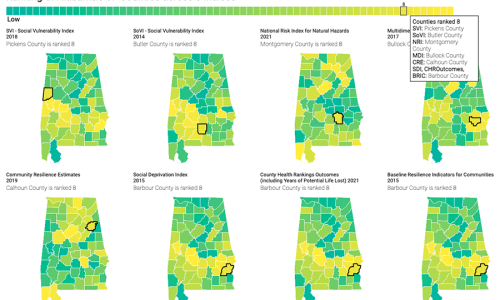
This project compares data for 8 national indices, as well as the census measures that go into 15 additional indices to provide an overview of how indices are made, by whom, and for what purpose.
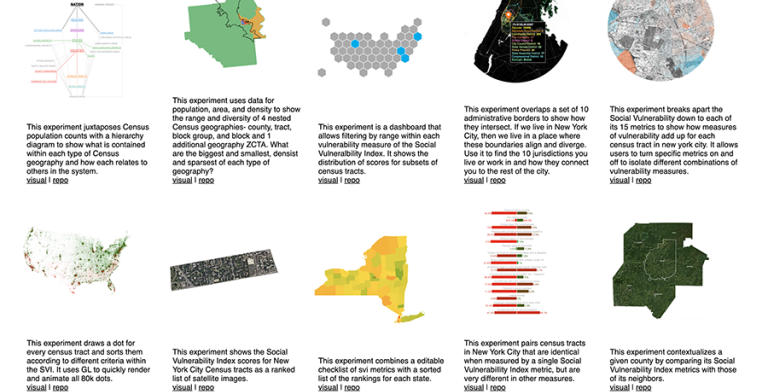
These experiments deal with how Census data is structured, packaged, and how it can be visualized interactively. Some address how these data points exist in the Census ecosystem, while others are technical opportunities and solutions.
All code is always open to use, and open to accepting requests and changes.
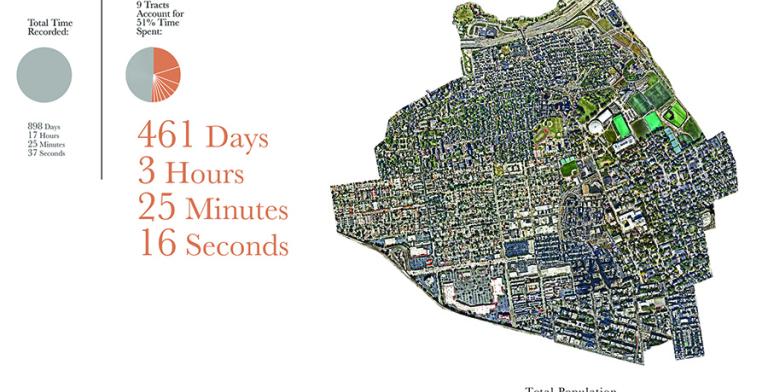
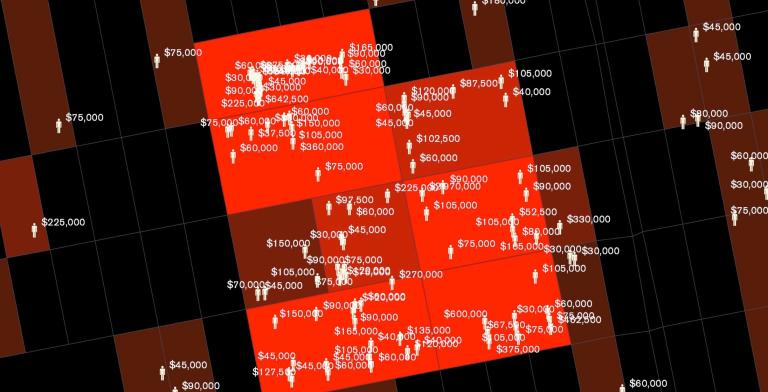
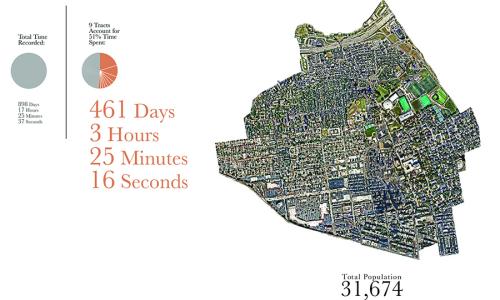
This project visualizes the U.S. Census through the lens of 1 person’s location data over the course of 3 years. It addresses the potential of self quantification in the personalization of public aggregate data. We are constantly viewed through data collected from us. However, despite the increasing nuance and sophistication of classification and categorization systems, the formalization of categories is always going to be playing catch up to how we can define ourselves. Is it possible that we can challenge the transactional nature of our current relationship with data by viewing aggregate data through the lens of self knowledge?
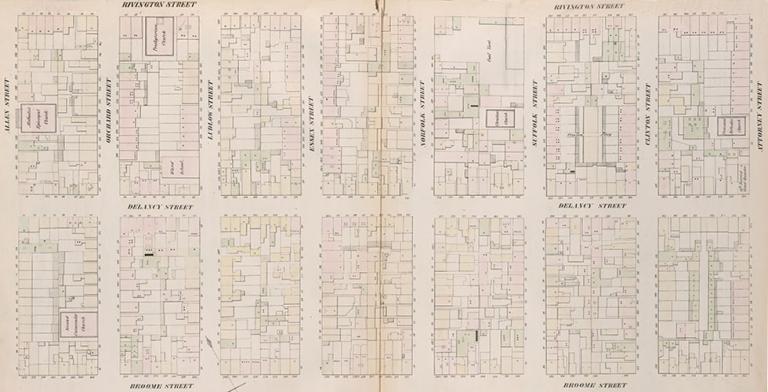
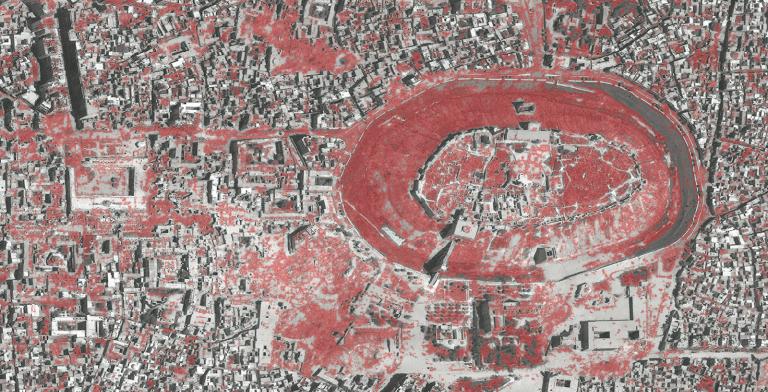
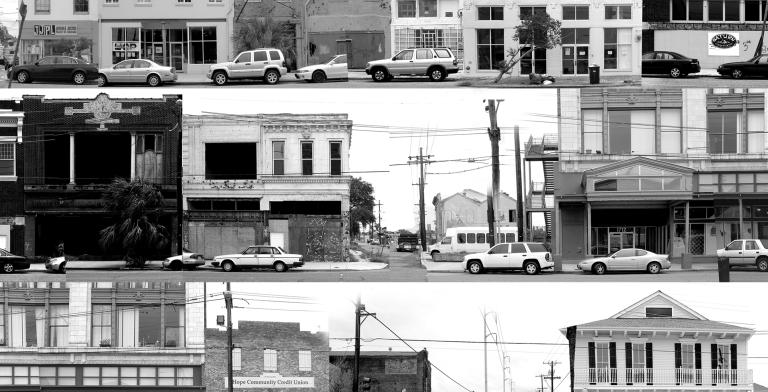
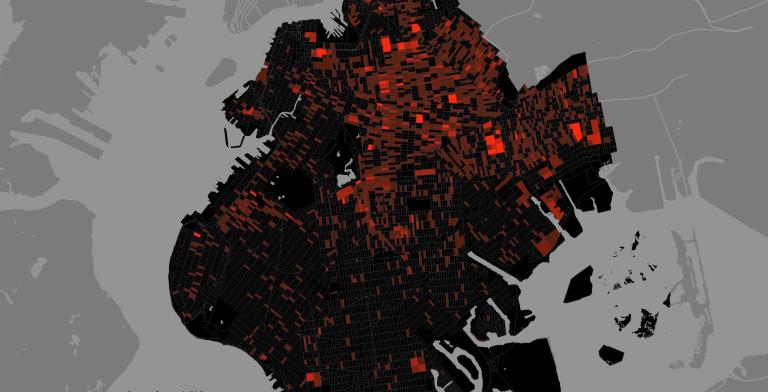
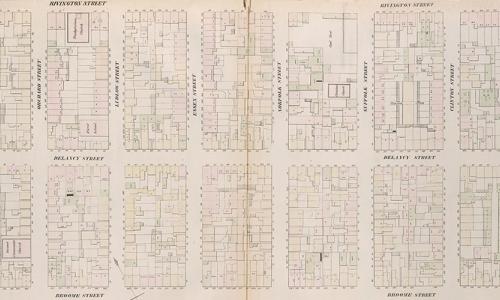
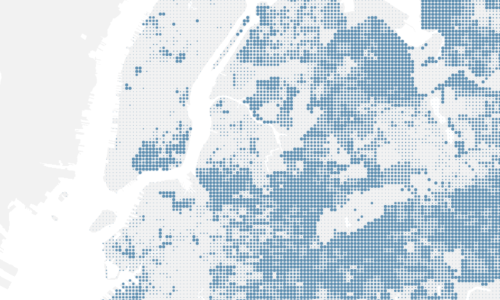
Mapping Historical New York: A Digital Atlas visualizes Manhattan’s and Brooklyn’s transformations during the late-nineteenth and early-twentieth centuries. Drawing on 1850, 1880, and 1910 census data, it shows how migration, residential, and occupational patterns shaped the city.
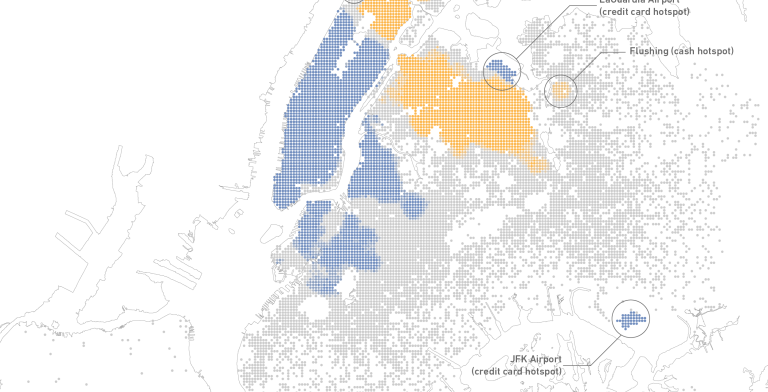
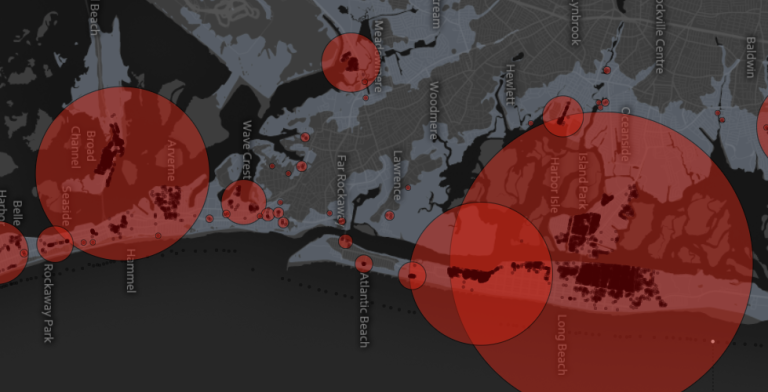
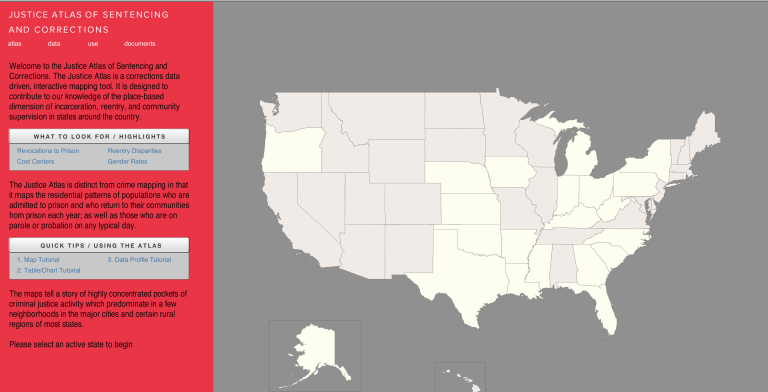
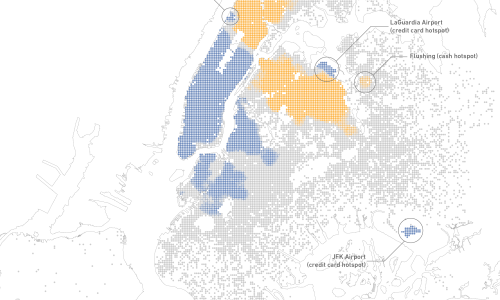
The Banking Divide For Taxi Access: Evidence From New York City
Since 2008 yellow taxis have been able to process fare payments with credit cards, and credits cards are a growing share of total fare payments. However, the use of credit cards to pay for taxi fares varies widely across neighborhoods, and there are strong correlations between cash payments for taxi fares, cash payments for transit fares and the presence of unbanked or underbanked populations. In this paper we use multiple datasets to explore taxicab fare payments by neighborhood and examine how access to taxicab services is associated with use of conventional banking services.
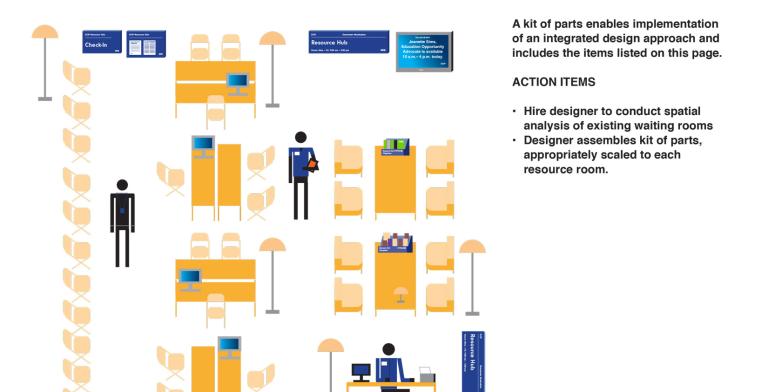
This project is an analysis of New York City neighborhoods according to specific health, demographic and environmental metrics. We worked with the New York Restoration Project (NYRP), which is developing a master plan to renovate a network of open spaces in Mott Haven and Port Morris in the South Bronx. Over the next several years, NYRP will fund the renovations and build them. As a first step, we will capture baseline health data and quality of life indicators which we will track as the project progresses.
As has been recently documented by the press, one of the major challenges that Citi Bike is facing is the rebalancing of their stations. As origins and destinations of Citi Bike trips are not necessarily symmetrical during the day, Citi Bike has been forced to constantly move bikes around the city, taking them from full stations and delivering them to empty ones. This problem is both financially expensive and frustrating for Citi Bike users: many people complain about either not finding bikes at their stations of origin or not finding empty spots when they arrive at their final destinations.
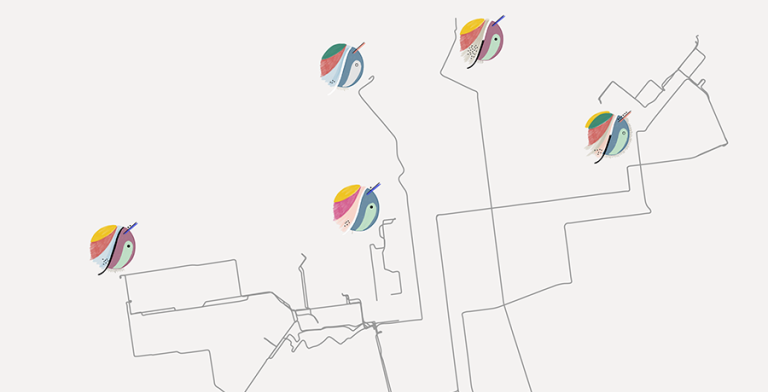
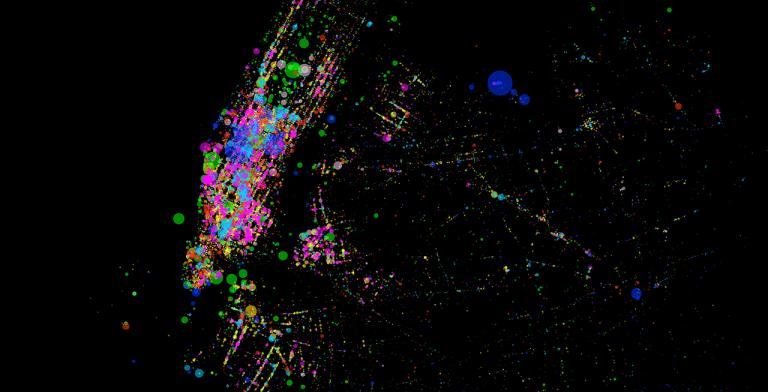
Social media are increasingly becoming part of our everyday lives, from connecting with friends and sharing images to exploring cities through location-based applications. These new services have given us a different vantage point from which to understand, explore, navigate, and geographically record the places we live. This project explores the new geogrphies produced by these new services through a series of maps.